Robotcyber

Reku - Beli crypto & saham AS

Daftar disini dan dapatkan hadiah uang tunai Rp150.000

Iklan 3

Ajaib: Saham bond & Reksadana

Daftar disini dan dapatkan hadiah uang tunai Rp150.000

Iklan 3

TRIV : Marketplace Cryptocurrency

Daftar disini dan dapatkan hadiah uang tunai Rp150.000

Iklan 3

SolCex Exchange adalah CEX utama untuk Memecoin

Daftar disini dan dapatkan hadiah uang tunai Rp150.000

Iklan 3

Daftar solcex sekarang!!

Daftar disini dan dapatkan airdrop sekarang

Reef Token (REEF) Shows Signs of Recovery After Recent Market Fluctuations


The Reef token (REEF), a popular asset in the cryptocurrency market, has shown a slight upward trend, signaling possible stability following a volatile month. As of October 31, 2024, the token is trading at approximately $0.00158, marking a 2.4% increase in the past 24 hours. The token’s recovery has caught the attention of crypto investors, especially given its sharp fluctuations earlier in the month.

Market Overview and Recent Performance

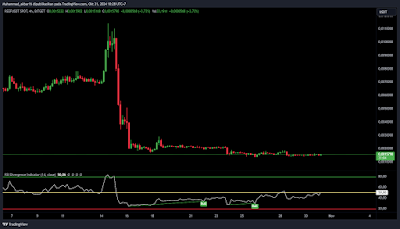
REEF, currently ranked #613 among cryptocurrencies, has maintained a market capitalization of around $60.89 million with a fully diluted valuation that matches this figure. Over the past 24 hours, the trading volume has surged to approximately $11.92 million, indicating heightened interest and activity among traders. The price range for the day has been between $0.001511 and $0.001632, with the token recovering from recent lows, as depicted on various crypto platforms.

A closer look at the 4-hour REEF/USDT chart reveals that the token recently experienced a strong upward movement followed by a dramatic drop. This high volatility is common in cryptocurrency markets, often influenced by broader market sentiments and sudden large trades. The chart shows several rapid movements over the last few days, with a spike reaching as high as $0.007 before falling back to more stable levels around $0.00158.

RSI Analysis and Trading Signals

The Relative Strength Index (RSI) on the 4-hour chart for REEF currently sits at 50.06, indicating a neutral position in terms of market momentum. Historically, an RSI reading above 70 suggests overbought conditions, while a reading below 30 indicates oversold conditions. The current neutral position suggests that the token could be consolidating, giving investors time to strategize their next moves. The presence of several "Bull" signals, as noted in recent technical analysis, may suggest that bullish trends could be emerging, although the market still shows signs of caution among traders.

Factors Influencing REEF's Recent Volatility

REEF’s recent performance has been influenced by various external and internal factors. On the macroeconomic front, global market uncertainties, regulatory news, and movements in major cryptocurrencies like Bitcoin and Ethereum can directly affect altcoins like REEF. As REEF trades on various decentralized platforms, any shifts in these larger assets tend to reflect on its price.

Moreover, Reef's unique position as a DeFi platform focusing on cross-chain trading and integration with different blockchain ecosystems has attracted significant interest. Reef’s ecosystem aims to simplify decentralized finance (DeFi) processes, making it easier for users to participate in staking, trading, and yield farming across multiple blockchain networks. Despite the token’s relatively low price, the long-term potential of the platform has kept REEF in the spotlight among DeFi and Web3 enthusiasts.

Community and Developer Updates

Reef has continued to foster its community, maintaining active communication channels through Twitter, Telegram, and Discord. The development team has been working on technical upgrades, ensuring that the Reef chain remains competitive within the blockchain ecosystem. The project’s roadmap includes enhancements aimed at expanding Reef’s capabilities in NFTs, metaverse projects, and gaming.

Looking Ahead: Market Predictions and Future Outlook

With the recent signs of stabilization, analysts and investors are closely monitoring REEF’s performance. Given the current market sentiment, the token could see either a breakout above current resistance levels or a retracement to test lower support zones if the broader market sentiment turns bearish. The RSI neutrality suggests room for movement in either direction, making it a potentially attractive asset for traders looking for short-term gains.

In conclusion, Reef's recent 2.4% price increase is a welcome development for the token's holders. As the platform continues its efforts to enhance the DeFi experience and attract more users to its ecosystem, there is cautious optimism about the token's potential. However, investors should remain aware of the high volatility and ensure proper risk management, especially in a market as unpredictable as cryptocurrency.

Today, Neiro (NEIRO) is trading at $0.09679, marking a 1.5% decrease over the past 24 hours. Here is a breakdown of NEIRO's current performance, market details, and technical outlook.


Neiro (NEIRO) Daily News - October 31, 2024

Today, Neiro (NEIRO) is trading at $0.09679, marking a 1.5% decrease over the past 24 hours. Here is a breakdown of NEIRO's current performance, market details, and technical outlook.

1. Recent Price Movements

  • Price Range (24h): $0.09005 - $0.1015
  • Current Price: $0.09679
  • Change (24h): -1.5%

Over the past 24 hours, NEIRO has shown volatility, with its price moving between $0.09005 and $0.1015. The chart indicates fluctuations with peaks and troughs, showing intermittent recoveries after each decline.

2. Market Cap and Supply

  • Market Cap: $96,780,761
  • Total Supply: 1,000,000,000 NEIRO
  • Circulating Supply: 1,000,000,000 NEIRO

NEIRO's market cap sits at approximately $96.78 million, and its circulating supply is capped at 1 billion tokens, which is also the maximum supply. With no additional tokens available for release, the price may react more significantly to market demand.

3. Trading Volume and Activity

  • 24-hour Trading Volume: $33,907,544

The substantial trading volume suggests active interest from traders, though the recent price decline may indicate selling pressure or profit-taking.

4. Performance Comparisons

  • 1 Hour: +0.3%
  • 7 Hours: +31.1%
  • 14 Hours: +2.6%
  • 30 Hours: +34.0%

Despite the daily drop, NEIRO has shown impressive gains over the past 7 and 30 hours, with increases of 31.1% and 34.0%, respectively. This could point to a positive trend in the medium term, possibly driven by recent events or announcements in the NEIRO ecosystem.

5. Technical Analysis

The live chart shows NEIRO’s oscillating price movement with both upward and downward swings. The 24-hour trend reveals high volatility, suggesting traders should watch for potential support around $0.09005 and resistance near $0.1015.

6. Conclusion

NEIRO’s recent performance demonstrates volatility, which could present opportunities for both short-term traders and long-term holders. Monitoring key levels of support and resistance can help anticipate potential reversals or breakouts. As NEIRO continues to move within its daily range, traders are advised to use caution given the market's fluctuating sentiment.

Stay updated for more information on Neiro's market activity!

Today, the cryptocurrency Solcex (SOLCEX) has shown significant movement in the market, with the current price around $0.01846, down approximately 9.5% in the last 24 hours.


Solcex (SOLCEX) Daily News - October 31, 2024

Today, the cryptocurrency Solcex (SOLCEX) has shown significant movement in the market, with the current price around $0.01846, down approximately 9.5% in the last 24 hours. Let's dive into the price movements, influencing factors, and future projections for Solcex.

1. Recent Price Movements

The current SOLCEX price has fluctuated within a daily range of $0.01754 to $0.0204. The CoinGecko chart shows a high volatility pattern, where SOLCEX saw a sharp decline from its daily high, followed by several recovery attempts. The 24-hour trading volume is $565,503, indicating strong trading interest amid the volatility.

2. Market Cap and Supply

Solcex has a market cap of $18,457,643 with a maximum total supply of 999,989,100 SOLCEX. The circulating supply is nearly at the maximum, leaving minimal new supply. With all available supply in the market, SOLCEX’s price may be more sensitive to demand and market sentiment.


3. Technical Analysis

The TradingView image shows the 4-hour SOLCEX price trend. The chart indicates that SOLCEX is in an ascending channel, signaling potential for upward movement as long as it remains within this channel. A strong support level is around $0.0174, while resistance lies near $0.02.

The RSI Divergence Indicator shows previous “Bull” signals at lower levels and “Bear” signals at higher levels, reflecting trend reversals at these points. The current RSI level is 48.37, close to neutral. This suggests that SOLCEX is in a consolidation phase, with selling and buying pressure almost balanced. However, a strong movement may occur if RSI approaches overbought or oversold levels.

4. Market Sentiment

SOLCEX experienced a sharp 9.5% drop in the last 24 hours. This decline may be due to profit-taking by short-term investors or broader negative sentiment in the market. Short-term fluctuations are common in the crypto market and tend to be influenced by factors such as macroeconomic conditions, cryptocurrency policies, and overall crypto market trends.

On the other hand, SOLCEX has shown a 43.9% increase over the past week and an impressive 234.1% increase over the past month. This trend suggests that, despite today’s dip, SOLCEX has had considerable price appreciation over a longer period, possibly due to previous positive news or developments.

5. Future Price Outlook

Looking at the technical trend, there is a chance for SOLCEX to move upward again if it stays within the ascending channel. If the price breaks through the resistance around $0.02, the next target could be around $0.025 or even higher. However, if the price breaks below the support level of $0.0174, further decline may occur, with a potential target below $0.015.

For long-term investors, SOLCEX shows considerable potential as long as demand remains strong and supply is stable. However, it’s essential to stay aware of high volatility and consider proper risk management strategies.

6. Conclusion

Solcex (SOLCEX) presents an intriguing movement pattern today, with a short-term decline that may offer some investors a chance to enter at a lower price. Market sentiment and technical factors indicate potential for near-term recovery, but volatility remains a key factor to watch. Investors are encouraged to monitor support and resistance levels and technical indicators closely for better-informed decisions.

We hope this information helps you stay up to date with the latest on Solcex

SolCex (SOLCX) Experiences Significant Price Decline, Detailed Movement Analysis


SolCex (SOLCX) Experiences Significant Price Decline, Detailed Movement Analysis

As of October 30, 2024, the price of SolCex (SOLCX) is trading at USD 0.01854, a decline of 27.6% in the last 24 hours. This drop highlights high market volatility, with the lowest price at USD 0.01631 and the highest at USD 0.02652 within the same period. This situation is accompanied by a 24-hour trading volume of USD 3,389,877.

Currently, SolCex has a market capitalization of approximately USD 18,663,336 and a maximum total supply of 999,989,100 tokens. With circulating supply nearing its maximum, this could impact the token’s price and distribution in the long term.


Technical Analysis and Price Trend

Based on the 4-hour chart analysis on TradingView, the price movement of SOLCX appears to be within an ascending channel. Although the price is undergoing correction, the long-term trend shows potential for further gains. The chart indicates SOLCX has support around the USD 0.018 level, with potential to rebound toward the resistance level above USD 0.03 in the coming weeks.

The Relative Strength Index (RSI) indicator shows a bearish signal at 48.28. This signal indicates that selling pressure remains strong in the short term, though a price recovery may occur if the price reaches the oversold area and bounces from the support level.

Factors Affecting SOLCX Price Movement

  1. Negative Market Sentiment: This sharp decline may be influenced by broader uncertainty in the crypto market. Many investors are cautious and selling off in this volatile environment.

  2. Volatility in the Solana Network: As a token associated with the Solana ecosystem, SOLCX’s price movement is also affected by the network’s conditions, including network updates or disruptions.

  3. High Trading Volume: With a trading volume reaching millions of dollars in the last 24 hours, speculative activity appears to be a primary driver of SOLCX volatility.

Price Prediction and Short-Term Outlook

Chart analysis suggests that SOLCX’s short-term price movement will remain volatile. If the price can hold above the critical support level at USD 0.016, there is a chance of recovery pushing the price back above USD 0.02. However, if this support level does not hold, SOLCX may face further decline.

For the long-term outlook, assuming stability in the crypto market and positive developments in the Solana ecosystem, SOLCX has the potential to resume upward movement within the existing trend channel.


This news reflects the latest conditions and predictions based on recent technical data. Remain cautious of market fluctuations, and it’s advised to conduct thorough research before making investment decisions.

SATS (Ordinals) Experiences 11.0% Drop, Trading at $0.062359


The cryptocurrency SATS (Ordinals) has recently experienced a sharp decline, with the current price standing at $0.062359, reflecting an 11.0% drop in the past 24 hours. This downturn comes amid a market environment where volatility is affecting multiple digital assets, with SATS (Ordinals) no exception.

Key Market Metrics

SATS (Ordinals) exhibits a significant market presence, with a substantial market capitalization and active trading volume within the past day. The current data indicates a market cap nearing half a billion dollars, positioning it as a noteworthy player among cryptocurrencies with high-volume trading.

  • Market Capitalization: $495,336,254
  • Fully Diluted Valuation: $495,336,254
  • 24-Hour Trading Volume: $36,995,944
  • Circulating Supply: 2,100,000,000,000 SATS
  • Total Supply: 2,100,000,000,000 SATS
  • Maximum Supply: 2,100,000,000,000 SATS

With the circulating supply equaling the total supply, SATS (Ordinals) is fully distributed in the market, which could play a role in limiting potential inflation from further token releases.

Price Movement Analysis

Over the past 24 hours, SATS (Ordinals) has fluctuated between $0.06229 and $0.0661. The chart displays a clear downward trend, followed by a minor recovery, suggesting potential buyback interest as prices reached a lower level.

SATS (Ordinals) Performance Across Timeframes

  • 1-Hour: -0.8%
  • 24-Hour: -11.0%
  • 7-Day: -18.0%
  • 14-Day: -16.7%
  • 30-Day: -20.8%
  • 1-Year: +947.1%

Despite recent declines, SATS (Ordinals) shows an impressive 947.1% increase over the past year, indicating long-term growth. However, short-term indicators highlight a challenging phase, with consecutive losses over the past week and month.

Potential Factors Behind the Price Drop

Several factors could be influencing SATS (Ordinals)'s recent price movement:

  1. Market Correction: Given its substantial growth over the past year, the current drop may be a natural market correction as investors lock in gains.
  2. Investor Sentiment: The broader market sentiment might be cautious, with price adjustments across the cryptocurrency sector, influencing SATS (Ordinals) as well.
  3. Technical Factors: Short-term technical indicators might be favoring a bearish trend, leading to further selling pressure.

Conclusion

SATS (Ordinals) is currently experiencing a downturn, with its price at $0.062359 following an 11.0% drop in the past day. While recent movements show a bearish trend, the token's significant annual growth suggests long-term investor interest. Traders and investors should stay informed on market conditions and broader trends impacting SATS (Ordinals) to better navigate potential volatility.

Neiro (NEIRO) Faces a 4.8% Decline, Trading at $0.004174


The cryptocurrency Neiro (NEIRO) has seen a notable decrease in its value, with the price currently standing at $0.004174, marking a 4.8% drop over the past 24 hours. This decline reflects broader market volatility affecting several digital assets, as investors assess current economic factors and sentiment shifts within the cryptocurrency space.

Key Market Metrics

Neiro’s market data highlights a relatively small-scale market, with a market capitalization of approximately $4.18 million. The trading volume in the past 24 hours reached around $11.1 million, suggesting active interest and transactions despite the price dip.

  • Market Capitalization: $4,177,476
  • Fully Diluted Valuation: $4,177,476
  • 24-Hour Trading Volume: $11,108,460
  • Circulating Supply: 999,934,457 NEIRO
  • Total Supply: 999,934,457 NEIRO
  • Maximum Supply: 1,000,000,000 NEIRO

These figures indicate a near-complete circulation of NEIRO’s total supply, which could influence its future scarcity and potential market dynamics.

Price Movement Analysis

Over the past 24 hours, Neiro’s price has fluctuated between $0.004019 and $0.005016. The chart shows a sharp peak, followed by a consistent decline, reflecting volatility that could be due to market reactions to short-term events or fluctuations in demand.

Neiro’s Performance Over Various Timeframes

  • 1-Hour: -1.2%
  • 24-Hour: -4.8%
  • 7-Day: -15.1%
  • 14-Day: +15.7%
  • 30-Day: +19.5%
  • 1-Year: Data not provided

Neiro has shown a decline over the past week, while its performance over the last 14 and 30 days remains positive, suggesting some recovery or growth in previous weeks despite recent declines.

Possible Reasons Behind the Price Decline

Several factors might be contributing to NEIRO’s price drop:

  1. Market Correction: The cryptocurrency market often undergoes rapid corrections, especially after recent gains, as seen in Neiro’s performance over the past month.
  2. Investor Profit-Taking: Investors might be selling NEIRO to secure recent gains, resulting in increased selling pressure.
  3. Market Sentiment: Market-wide volatility or caution due to economic uncertainties could be causing temporary bearish sentiment.

Conclusion

Neiro’s recent drop to $0.004174 reflects a combination of market volatility and potential profit-taking by investors. Despite short-term declines, Neiro’s positive performance over the last month indicates underlying investor interest and potential for future recovery. However, as with all volatile assets, investors should remain cautious and informed about broader market trends and Neiro’s price action.

Bitcoin Price Drops to $66,468.94 Amid Market Volatility


Bitcoin (BTC), the world’s largest cryptocurrency, has experienced a 2.2% drop in the last 24 hours, trading at $66,468.94. The recent downward trend follows a period of fluctuation, as Bitcoin’s price ranged between $65,563.64 and $68,654.55 throughout the day. This article examines the current market dynamics, underlying causes of this price dip, and the broader impact on investor sentiment.

Key Market Metrics

As of now, Bitcoin’s market capitalization stands at approximately $1.314 trillion, with a fully diluted valuation at around $1.395 trillion. The trading volume in the past 24 hours reached $49.586 billion, reflecting high trading activity despite the recent dip.

  • Market Capitalization: $1,314,292,829,744
  • 24-Hour Trading Volume: $49,586,466,588
  • Circulating Supply: 19,773,037 BTC
  • Total Supply: 21,000,000 BTC (maximum supply)

These metrics underscore Bitcoin’s continued dominance in the crypto market, even as its price experiences fluctuations.

Price Movement Analysis

The chart shows a notable decline in Bitcoin’s price, peaking near $68,654 before dropping to approximately $66,468. Despite intermittent recoveries, the overall sentiment remains bearish. This short-term decline may be attributed to increased sell-offs and potentially cautious market behavior ahead of economic updates or industry developments.

Bitcoin’s Performance Over Various Timeframes

  • 1-Hour: 0.0%
  • 24-Hour: -2.2%
  • 7-Day: -2.7%
  • 14-Day: +6.0%
  • 30-Day: +5.8%
  • 1-Year: +91.6%

While Bitcoin’s weekly and daily performance shows a decline, its longer-term growth over the past year remains strong, with a notable 91.6% increase.

Possible Reasons Behind the Price Decline

Several factors may be contributing to Bitcoin’s recent price decrease:

  1. Market Volatility: Cryptocurrency prices are often highly volatile, influenced by market sentiment and external economic factors. The recent dip may be part of a broader correction after the recent price rally.
  2. Regulatory Concerns: Any news related to regulatory actions or potential crackdowns on crypto trading could induce temporary sell-offs.
  3. Profit-Taking by Traders: After Bitcoin’s recent gains, some traders might be selling to lock in profits, leading to increased downward pressure.
  4. Global Economic Concerns: As Bitcoin often reacts to global economic indicators, potential uncertainties in traditional markets might be influencing cryptocurrency prices.

Long-Term Perspective and Investor Outlook

Despite the recent pullback, Bitcoin has shown resilience in the face of market fluctuations. Its long-term growth of over 90% within a year demonstrates continued interest and optimism among investors, particularly those holding BTC for the long term. Investors who believe in Bitcoin’s role as a hedge against traditional financial systems may view this price drop as an opportunity to accumulate.

Conclusion

Bitcoin’s price dip to $66,468.94 is reflective of short-term volatility in the cryptocurrency market. Key factors influencing this decline include market volatility, potential profit-taking, and broader economic factors. However, Bitcoin’s substantial yearly growth keeps the bullish outlook intact for long-term investors. As the crypto market continues to evolve, Bitcoin’s price movement will remain a key indicator of overall market sentiment.


Prom Token (PROM) Records a 47.3% Price Surge: What’s Behind It?


In the past 24 hours, the Prom token (PROM) has seen a significant price surge of 47.3%, reaching a value of $7.92 per token. This increase marks one of the highest spikes in the cryptocurrency market today. Let’s dive deeper into the factors that might be influencing this price surge.

Market Capitalization and Trading Volume Details

With a market capitalization currently at $141,137,682, Prom token shows considerable growth. The trading volume over the last 24 hours has reached $174,763,625, reflecting high interest from both investors and crypto traders.

  • Market Capitalization: $141,137,682
  • 24-Hour Trading Volume: $174,763,625
  • Total Supply: 19,250,000 PROM
  • Circulating Supply: 18,250,000 PROM

This drastic increase in trading volume indicates a rising demand for the PROM token from both daily traders and long-term investors.

24-Hour Price Movement Chart

Based on the price movement chart, PROM token traded within a range of $5.28 to $9.83 in the last day. A sharp spike occurred around midnight to early morning, with the price peaking at $9.83 before correcting back to around $7.92.

Performance Across Different Time Frames

According to CoinGecko data:

  • In the last 1 hour: up 2.9%
  • In the last 24 hours: up 47.3%
  • In the last 7 days: up 51.1%
  • In the last 14 days: up 43.8%
  • In the last 30 days: up 40.9%
  • In the last 1 year: up 85.0%

This price surge reflects positive momentum for the PROM token both in the short and long term.

Factors Driving the Price Increase

Several potential factors could be driving this price surge:

  1. Positive Market Sentiment: With the crypto market in a positive phase, many investors are increasing their investments in various tokens, including PROM.
  2. Strong Fundamentals: Prom (PROM) is known to have a strong community and frequently receives updates from its development team. Positive updates or developments within the Prom ecosystem could be driving the price up.
  3. Increased Liquidity: The high trading volume indicates good liquidity, making this token more appealing to both large and small investors.
  4. Growing Global Interest in Crypto: Rising interest in crypto assets, driven by blockchain adoption across various industries, has boosted demand.

What’s Next for Prom Token?

While this significant price rise brings optimism to investors, it’s essential to remember the high volatility in cryptocurrency prices. Investors are advised to remain cautious in making investment decisions. This surge could be followed by a price correction in the coming days, especially after reaching psychological resistance levels around $9 to $10.

Conclusion

The Prom token (PROM) has gained market attention with a price increase of over 47% in the last day. Key drivers include high trading volume, strong fundamentals, and positive market sentiment. However, volatility remains a key feature of the crypto market, and investors are encouraged to trade wisely.


This article aims to provide deeper insights for those interested in the latest developments in the crypto market, particularly regarding the Prom (PROM) token.

ZAM.io (ZAM) Terpuruk 37,1%: Apa yang Terjadi dengan Proyek DeFi Ini?


ZAM.io (ZAM), salah satu token di ekosistem keuangan terdesentralisasi (DeFi), mengalami penurunan harga signifikan hingga 37,1% dalam 24 jam terakhir. Saat ini, ZAM diperdagangkan pada level $0.0003652. Kejatuhan ini juga mencerminkan kinerja buruk ZAM terhadap Bitcoin (BTC), di mana nilai token ini terhadap BTC turun hingga 38,6%.

Detail Pasar 24 Jam Terakhir

  • Harga ZAM mengalami fluktuasi besar dalam 24 jam terakhir, dengan harga terendah di $0.000347 dan harga tertinggi di $0.0006001. Rentang ini menunjukkan volatilitas pasar yang cukup tinggi untuk token yang relatif baru ini.
  • Volume perdagangan harian tercatat di $322.732, yang menggambarkan adanya aktivitas jual-beli yang cukup besar di tengah kondisi pasar yang bearish.
  • Total suplai token ZAM adalah 67.780.777, namun kapitalisasi pasar ZAM saat ini belum diketahui secara pasti.
  • Valuasi terdilusi penuh token ZAM berada pada angka $25.026,05, menggambarkan jumlah nilai maksimum yang mungkin dicapai jika semua token ZAM yang beredar terjual pada harga pasar saat ini.

Tren Penurunan Harga: Sentimen Pasar atau Fundamenta Proyek?

Penurunan harga yang drastis ini memicu kekhawatiran bagi investor dan pelaku pasar kripto. Banyak yang bertanya-tanya apakah penurunan tajam ini disebabkan oleh sentimen pasar secara umum, atau ada masalah mendasar dalam proyek ZAM.io itu sendiri. Dalam beberapa pekan terakhir, pasar kripto secara keseluruhan memang mengalami ketidakstabilan, di mana faktor-faktor makroekonomi seperti suku bunga global dan kebijakan moneter di beberapa negara besar memberikan dampak signifikan terhadap aset-aset berisiko tinggi seperti kripto.

Namun, untuk ZAM.io, penurunan harga ini mungkin lebih dipengaruhi oleh sentimen spekulatif. Meskipun ekosistem keuangan terdesentralisasi (DeFi) masih menarik bagi investor, pasar tampaknya bereaksi negatif terhadap kurangnya pembaruan signifikan atau kemajuan teknologi yang dijanjikan oleh tim pengembang ZAM.io.

Apa Itu ZAM.io?

ZAM.io adalah platform DeFi yang bertujuan untuk menjembatani sektor keuangan tradisional dan dunia kripto. Salah satu produk unggulannya adalah ZAMZAM dan fitur smart contract yang memudahkan transfer nilai antara dunia kripto dan fiat. Dengan ambisi ini, ZAM.io menargetkan untuk menyediakan infrastruktur yang lebih aman dan transparan bagi pengguna yang ingin terlibat dalam sektor keuangan berbasis blockchain.

Namun, seperti banyak proyek DeFi lainnya, ZAM.io harus bersaing ketat dengan puluhan, bahkan ratusan, proyek lain yang menawarkan fitur serupa. Dalam situasi pasar yang bergejolak, investor cenderung mencari aset yang lebih stabil atau proyek yang memiliki roadmap yang lebih jelas dan sudah terbukti.

Mengapa Harga ZAM Anjlok?

Ada beberapa faktor potensial yang menyebabkan penurunan harga ZAM.io:

  1. Volatilitas Pasar Kripto: Saat ini, pasar kripto secara keseluruhan sedang mengalami penurunan. Bitcoin (BTC) dan Ethereum (ETH), dua kripto terbesar, mengalami fluktuasi besar yang turut menarik aset-aset berkapitalisasi kecil, termasuk ZAM, ke tren penurunan.

  2. Minimnya Sentimen Positif: Meskipun ZAM.io adalah proyek yang berpotensi, tidak ada pembaruan besar atau berita yang dapat mendongkrak minat investor dalam beberapa minggu terakhir. Tanpa berita positif atau kemajuan yang signifikan, investor mungkin kehilangan kepercayaan dan memutuskan untuk menjual token mereka.

  3. Likuiditas Rendah: Token dengan kapitalisasi pasar kecil seperti ZAM.io sering kali memiliki likuiditas yang rendah. Hal ini berarti ketika terjadi aksi jual besar, harga token bisa jatuh dengan cepat tanpa banyak pembeli untuk menyeimbangkan permintaan dan penawaran di pasar.

  4. Spekulasi Investor: Pada proyek-proyek DeFi, ada banyak investor yang berspekulasi dan hanya mencari keuntungan cepat. Ketika mereka merasa target harga jangka pendek sudah tercapai atau pasar mulai menunjukkan tanda-tanda koreksi, mereka cenderung melepas aset mereka dengan cepat, yang dapat memicu aksi jual massal.

Prospek ZAM.io di Masa Depan

Meskipun harga ZAM.io saat ini sedang dalam tren turun, proyek ini tetap memiliki prospek yang baik di dunia DeFi. Teknologi yang ditawarkan oleh ZAM.io, khususnya dalam hal integrasi antara fiat dan kripto, masih relevan dan berpotensi besar dalam jangka panjang. Dengan meningkatnya adopsi blockchain dan teknologi keuangan terdesentralisasi, ZAM.io bisa mendapatkan kembali momentumnya jika tim pengembang mampu memberikan inovasi dan menepati janji-janji dalam roadmap mereka.

Namun, untuk jangka pendek, investor disarankan untuk berhati-hati dan mengikuti perkembangan berita serta pembaruan dari tim pengembang. Fluktuasi harga yang tinggi ini mengindikasikan pasar yang belum stabil, dan pergerakan harga ZAM bisa dipengaruhi oleh faktor eksternal di luar kontrol proyek.

Kesimpulan

Dengan penurunan sebesar 37,1% dalam 24 jam terakhir, ZAM.io menghadapi tantangan besar di tengah pasar kripto yang fluktuatif. Meskipun demikian, proyek ini tetap memiliki potensi jangka panjang sebagai platform DeFi yang menjanjikan. Bagi investor yang sudah terjun di ZAM.io, masa depan mungkin masih penuh dengan peluang, namun membutuhkan kesabaran dan kewaspadaan dalam menghadapi volatilitas pasar.

DepinDao (Ordinals) Plunges 42.4% Amid Market Volatility


The cryptocurrency market is no stranger to dramatic swings, and DepinDao (Ordinals), a lesser-known digital asset, has recently experienced a significant drop in its value. As of October 25, 2024, DepinDao is trading at US$0.0002018, reflecting a sharp 42.4% decline in just 24 hours. This dip is part of a broader 43.9% decline in its Bitcoin (BTC) pairing, signaling heightened uncertainty surrounding this token.

DepinDao’s Recent Market Activity

The current price fluctuation is especially alarming given that DepinDao was trading at a high of US$0.0004106 within the past 24 hours, with a low of US$0.0001698. Such volatility often indicates low liquidity and market confidence, or a significant influx of selling pressure. With a 24-hour trading volume of US$199,567, there is some activity, but it remains a small fraction compared to more established cryptocurrencies.

Market Capitalization and Total Supply

One striking detail about DepinDao is that its market capitalization remains undisclosed on the platform, raising concerns among investors. The lack of a clear market cap could indicate uncertainty in the project's overall valuation. However, the fully diluted valuation (FDV), based on its maximum supply of 2.1 billion tokens, stands at US$402,732. This suggests that, while the token is experiencing a sharp decline, there may still be potential for future growth if market conditions stabilize.

The total supply of DepinDao is capped at 2.1 billion tokens, with all of these already in circulation. The fact that all tokens are already available on the market could explain some of the price suppression, as there is no expectation of future scarcity.

What Could Be Behind the Sudden Drop?

The substantial price drop of over 40% in a single day raises the question: what factors might be influencing DepinDao's market performance?

  1. Low Market Confidence: Without significant market capitalization data and with relatively low trading volumes, it is possible that investors are losing confidence in the project.

  2. General Crypto Market Conditions: The broader cryptocurrency market has been facing fluctuations, with Bitcoin and Ethereum showing downturns in recent weeks. This overall negative sentiment could be dragging smaller, less established tokens like DepinDao down.

  3. Sell-Off Pressure: The graph shows a sharp decline early in the day, likely indicating a large-scale sell-off. A lack of buyers to counterbalance the selling could have caused the price to plunge rapidly.

Comparison with Bitcoin and Ethereum

In comparison to major cryptocurrencies like Bitcoin (BTC) and Ethereum (ETH), DepinDao's performance is particularly stark. Over the last 24 hours, Bitcoin dropped by 11.8%, while Ethereum saw a decrease of 11.4%, highlighting that DepinDao’s fall is much steeper than the broader market. While the top two cryptos tend to recover quickly from fluctuations due to their size and liquidity, smaller altcoins like DepinDao may not experience such resilience.

Technical Analysis and Future Prospects

Looking at the trading chart, DepinDao experienced a significant sell-off around midday, followed by a period of stabilization. This pattern is common in assets that face sudden price crashes, as panic selling gives way to cautious buying or market stabilization. The price could remain low in the short term unless there is a fundamental catalyst to drive demand back up.

It is important to keep an eye on the trading volumes in the coming days, as an increase in volume could indicate a return of investor interest. Conversely, a continued decrease in volume may signal further price drops or stagnation.

Final Thoughts

The future of DepinDao remains uncertain at this time. The lack of clear market cap data, combined with significant price drops and low trading volumes, raises red flags for potential investors. However, the cryptocurrency market is known for its unpredictability, and DepinDao may yet see a rebound if the project manages to regain investor confidence or if broader market conditions improve.

Investors are advised to exercise caution and conduct thorough research before making any decisions related to DepinDao. Those interested in riskier, high-volatility assets may find opportunities in its current low prices, but the risks should not be overlooked.

Solana (SOL), one of the most prominent and innovative blockchain networks, continues to experience robust performance in 2024

Solana: A Comprehensive Market Update - October 25, 2024


Solana (SOL), one of the most prominent and innovative blockchain networks, continues to experience robust performance in 2024, building on its reputation for scalability, speed, and developer-friendly architecture. Today, Solana’s price fluctuates around $170.14 to $177.25, marking a significant rise of nearly 4% in the last 24 hours. This surge in value highlights investor confidence in the platform amid the larger cryptocurrency market's revival.

Solana’s Rise in the Crypto Ecosystem

Solana's network is regarded as a high-performance blockchain due to its capability to handle thousands of transactions per second (TPS), making it one of the fastest blockchains in operation today. This is primarily due to its innovative Proof of History (PoH) consensus combined with the traditional Proof of Stake (PoS) model. The combination provides a seamless transaction experience and has attracted a growing ecosystem of developers and decentralized applications (dApps).

The broader market sentiment towards Solana remains positive, especially considering its vast ecosystem, which includes decentralized finance (DeFi) projects, non-fungible tokens (NFTs), and other Web3 innovations. The network is often seen as a serious competitor to Ethereum due to its lower transaction costs and faster block times.

Recent Developments and Growth

In recent weeks, Solana has unveiled several noteworthy partnerships and technical upgrades. For instance, the integration of Solana Pay, a decentralized payments system, is gaining momentum, allowing merchants to accept cryptocurrencies seamlessly. Additionally, Solana’s NFT market remains one of the largest, with significant activity on platforms like Magic Eden and Metaplex.

Moreover, Solana's Breakpoint Conference, an annual event highlighting the network's achievements, is scheduled for later this year. The event is expected to shed light on future plans, including scalability upgrades and expanded partnerships. Rumors also suggest that Solana Labs might unveil a Layer 2 scaling solution, addressing congestion issues during peak times, thereby solidifying its status as a scalable blockchain solution.

Solana’s Institutional Interest

Solana has attracted significant interest from institutional investors and venture capital firms, primarily due to its scalability and the potential to serve the rapidly growing Web3 space. In early 2024, Solana Ventures raised over $1 billion to further enhance its ecosystem through investment in blockchain startups and Web3 projects.

This growing institutional interest is driven by the belief that Solana could support enterprise-level applications and decentralized finance products, a role traditionally dominated by Ethereum. Additionally, with the increasing adoption of DeFi protocols built on Solana, large financial players see it as a potential game-changer in the blockchain space.

Future Outlook and Challenges

While Solana's growth prospects remain bright, the platform is not without its challenges. Network outages, which have plagued the blockchain in the past, still linger as a concern. These interruptions are mainly attributed to the high transaction throughput overwhelming the network. However, Solana Labs has been working on network optimizations to address these issues, including the introduction of validator optimizations and new node architectures.

Despite these challenges, many analysts see Solana as a crucial player in the future of decentralized finance and Web3 due to its developer-friendly environment, low fees, and strong backing from both retail and institutional investors. Its growth in 2024 has also been driven by the increase in cross-chain bridges, facilitating the seamless transfer of assets between Solana and other blockchains like Ethereum and Avalanche.

Conclusion

As Solana continues to solidify its place within the cryptocurrency market, it remains a top choice for developers and investors alike, thanks to its scalable infrastructure and expanding ecosystem. With major updates and new features expected to be released, Solana’s future looks bright, though it must continue to address key concerns like network stability to maintain its upward trajectory. For now, the rise in Solana’s price and overall market confidence are strong indicators that it will remain a leading blockchain platform in the years to come.

Key Market Factors Influencing Bitcoin's Movement

Bitcoin Market Update: October 25, 2024


Bitcoin (BTC) continues to make headlines as it experiences a surge in price today, hitting $67,760.92, marking a 2.78% increase in the last 24 hours. With a total market cap of $1.34 trillion, Bitcoin remains the dominant cryptocurrency, showcasing resilience amid a volatile market environment. As investors closely watch this rise, Bitcoin’s trading volume over the past 24 hours stood at $30.33 billion, though slightly lower by 1.29%, indicating potential consolidation ahead.

Key Market Factors Influencing Bitcoin's Movement

  1. Institutional Demand & Adoption: Institutional involvement continues to be a significant driver for Bitcoin’s price surge. With major corporations and hedge funds increasing their BTC holdings, the ongoing adoption has lent stability to Bitcoin. Moreover, Bitcoin is increasingly viewed as a hedge against inflation, with the rising interest rates and economic instability further boosting its allure for long-term investors.

  2. Regulatory Developments: The market is also absorbing the impact of regulatory discussions across the globe. While certain regions are embracing cryptocurrency-friendly policies, other major economies, such as the U.S. and the European Union, are deliberating regulations on digital assets and decentralized finance (DeFi). Any updates or decisions on crypto regulation tend to cause volatility in the market, as it directly impacts investor confidence and adoption rates.

  3. Technical Developments and Halving Speculations: Investors are eagerly eyeing Bitcoin’s 2024 halving event, scheduled for mid-2024, which will cut mining rewards in half. Historically, Bitcoin halving events have triggered significant price rallies due to the reduced supply of new BTC entering the market. The anticipation of this event is leading many market participants to accumulate Bitcoin ahead of time.

  4. Global Economic Outlook: Macroeconomic factors are playing a pivotal role in Bitcoin’s ongoing bull run. With inflationary concerns persisting across several major economies, Bitcoin is being perceived as a store of value. Additionally, ongoing geopolitical tensions and fears of economic slowdowns have pushed investors to seek out alternatives like Bitcoin to safeguard their wealth.

Technical Analysis:

Bitcoin is currently trading at $67,760, marking an impressive recovery from previous levels. Over the last month, BTC has consistently broken through key resistance levels, with analysts now identifying the $70,000 level as the next major psychological threshold.

  • Support Level: The strongest support currently stands at around $65,000. If Bitcoin were to correct or face a sell-off, maintaining this support level would be crucial for preserving the current bullish momentum.

  • Resistance Level: On the upside, Bitcoin is expected to face its next key resistance at $70,000, which, if broken, could trigger a rally towards all-time highs.

From a technical standpoint, the Relative Strength Index (RSI) is showing a neutral reading, suggesting that while Bitcoin is on an upward trajectory, it is not yet in overbought territory. Analysts note that continued accumulation by long-term holders and whale activity is a positive signal for Bitcoin’s sustained growth in the coming weeks.

Market Sentiment:

The current market sentiment around Bitcoin is optimistic, as reflected in the Fear & Greed Index, which is trending toward Greed. Traders are increasingly bullish, fueled by Bitcoin’s recent performance and the broader anticipation around upcoming macroeconomic events. Additionally, the relatively low amount of BTC on exchanges indicates that holders are moving their assets into long-term storage, a trend often associated with positive price action in the near future.

Whale Activity and Accumulation:

One significant aspect of Bitcoin’s price movement today is the increasing activity of whale wallets. Large wallet addresses, holding over 1,000 BTC, have shown an uptick in their Bitcoin holdings, suggesting accumulation ahead of a potential price breakout. Whale movements are often a reliable indicator of broader market sentiment, as these large investors tend to anticipate major price movements before they occur.

Broader Cryptocurrency Market Impact:

As Bitcoin rises, the impact on the broader cryptocurrency market is evident. Ethereum (ETH), Solana (SOL), and other major altcoins have also seen price increases, with Ethereum currently up 3.1% in the last 24 hours, trading near the $1,900 level. The total cryptocurrency market cap now sits at around $2.1 trillion, with Bitcoin’s dominance at 48.7%.

What’s Next for Bitcoin?

As Bitcoin continues to surge, market participants are paying close attention to upcoming events, including regulatory announcements from the U.S. SEC regarding the approval of a Bitcoin ETF, which could drive further demand. Additionally, the ongoing macroeconomic challenges and Bitcoin’s limited supply are providing fundamental reasons for continued price appreciation.

In the short term, analysts expect Bitcoin to consolidate between the $65,000 and $70,000 range. However, any significant news or regulatory developments could act as a catalyst for a new bull run, potentially pushing Bitcoin toward its all-time high of $69,000 and beyond.

Conclusion:

Bitcoin’s current performance is indicative of the broader trends in the cryptocurrency market, where institutional adoption, macroeconomic factors, and upcoming technical events like the halving are pushing demand higher. With its price nearing $68,000, Bitcoin remains a key focus for both retail and institutional investors, and the coming weeks could prove crucial in determining whether BTC will break past its previous highs.

Investors are advised to watch for key market signals and stay updated on the latest regulatory developments, which could heavily influence Bitcoin’s price trajectory in the near future.

SolCex Siap Luncurkan Fitur Staking pada 29 Oktober: Peluang Besar Bagi Investor


SolCex Siap Luncurkan Fitur Staking pada 29 Oktober: Peluang Besar Bagi Investor

SolCex, platform aset digital yang berkembang pesat, baru saja mengumumkan rencana peluncuran fitur terbarunya yang dinanti-nantikan, yaitu staking, pada tanggal 29 Oktober 2024. Melalui pengumuman resmi mereka di media sosial, SolCex menegaskan bahwa fitur staking ini akan memberi kesempatan bagi pengguna untuk meraih pendapatan pasif yang lebih besar melalui investasi mereka. Ini merupakan langkah maju yang signifikan bagi SolCex dalam memantapkan posisinya di dunia kripto yang terus berkembang.

Apa Itu Staking di SolCex?

Staking adalah proses di mana pemilik aset kripto "mengunci" token mereka dalam jaringan blockchain untuk membantu mempertahankan keamanan jaringan dan mengonfirmasi transaksi. Sebagai imbalannya, pengguna yang melakukan staking akan menerima hadiah dalam bentuk token tambahan. Dalam kasus SolCex, pengguna yang memiliki koin SOLCEX akan dapat melakukan staking dan menerima imbalan secara langsung dari platform. Ini berarti semakin banyak token yang di-stake oleh pengguna, semakin besar pula potensi penghasilan mereka dari hadiah staking.

Dengan peluncuran fitur staking ini, SolCex mengadopsi salah satu fitur kunci yang sering kali menjadi daya tarik utama bagi pengguna yang ingin berinvestasi dalam jangka panjang dan mencari peluang untuk menghasilkan pendapatan tanpa harus aktif berdagang setiap hari. Proses staking juga membantu meningkatkan stabilitas jaringan blockchain, membuatnya semakin aman dan efisien.

Mengapa Fitur Staking Ini Penting bagi Pengguna?

Ada beberapa alasan mengapa peluncuran fitur staking pada SolCex ini menjadi momen yang sangat dinantikan oleh para pengguna dan investor kripto:

  1. Penghasilan Pasif yang Menguntungkan: Salah satu manfaat utama dari staking adalah kesempatan untuk memperoleh penghasilan pasif. Investor tidak perlu aktif melakukan trading atau mengambil risiko volatilitas jangka pendek. Cukup dengan mengunci koin SOLCEX mereka, mereka dapat memperoleh imbalan staking dalam bentuk tambahan token. Ini menjadi solusi yang menarik bagi para pemegang aset yang berfokus pada strategi jangka panjang.

  2. Meningkatkan Nilai Ekosistem: Staking juga membantu memperkuat jaringan blockchain. Dengan semakin banyaknya koin yang di-stake, keamanan jaringan meningkat karena staker (orang yang melakukan staking) membantu memvalidasi transaksi dan memelihara integritas jaringan. Dalam konteks SolCex, ini berarti peningkatan stabilitas dan keamanan keseluruhan ekosistem, yang pada akhirnya dapat berdampak positif pada kepercayaan investor dan kenaikan harga koin SOLCEX.

  3. Diversifikasi Pendapatan dalam Kripto: Bagi banyak investor kripto, staking merupakan salah satu cara untuk mendiversifikasi sumber pendapatan mereka. Selain keuntungan dari potensi kenaikan harga koin, pengguna juga bisa memperoleh pendapatan tambahan dari hasil staking. Hal ini memungkinkan mereka untuk memanfaatkan aset kripto mereka secara maksimal tanpa harus menjual atau memperdagangkan token mereka.

  4. Stabilitas Jangka Panjang: Dengan fitur staking, pengguna yang memiliki pandangan investasi jangka panjang dapat lebih mudah mempertahankan posisi mereka. Mereka bisa terus mendapatkan imbalan sambil menunggu kenaikan harga koin SOLCEX di masa depan. Staking membantu menjaga volatilitas aset karena token yang di-stake tidak langsung diperdagangkan di pasar terbuka, sehingga dapat mengurangi tekanan jual.

Apa yang Diharapkan dari Peluncuran Fitur Ini?

Peluncuran staking SolCex pada 29 Oktober 2024 diperkirakan akan memicu minat yang besar dari komunitas kripto. Banyak investor yang sudah lama menunggu peluang ini karena staking telah terbukti menjadi salah satu fitur kunci yang dapat menarik lebih banyak pengguna ke platform kripto. Sejak pengumuman ini dipublikasikan di akun Twitter resmi SolCex pada 20 Oktober, reaksi dari komunitas sangat positif, dengan banyaknya tanggapan dan antusiasme yang terlihat dalam jumlah "likes" dan "shares."

Berdasarkan postingan tersebut, pengguna diharapkan segera menandai tanggal peluncuran ini di kalender mereka, karena ini akan menjadi saat di mana mereka dapat mulai melakukan staking dan menikmati imbalan yang telah lama dinantikan. Selain itu, perusahaan juga mengisyaratkan bahwa staking ini akan memberikan peluang untuk mendapatkan penghasilan yang lebih tinggi, yang tentunya menjadi insentif tambahan bagi para investor.

Bagaimana Cara Melakukan Staking di SolCex?

Meskipun detail teknis dari proses staking belum diumumkan sepenuhnya, biasanya langkah-langkah umum untuk melakukan staking pada platform kripto seperti SolCex adalah sebagai berikut:

  1. Memiliki Dompet Kripto yang Terhubung: Pengguna perlu memiliki dompet kripto yang terhubung dengan platform SolCex, seperti SolFlare, yang mendukung staking koin SOLCEX. Ini akan menjadi tempat untuk menyimpan dan mengunci token mereka selama periode staking.

  2. Pilih Jumlah Token untuk Staking: Pengguna akan memilih jumlah koin SOLCEX yang ingin mereka stake. Beberapa platform juga memungkinkan pengguna untuk memilih periode waktu tertentu di mana token akan terkunci, dengan imbalan yang sesuai.

  3. Menerima Imbalan Staking: Setelah proses staking dimulai, pengguna akan secara berkala menerima imbalan berdasarkan jumlah token yang mereka stake. Imbalan ini biasanya dibayarkan dalam bentuk token tambahan, yang kemudian bisa diinvestasikan kembali atau diperdagangkan di pasar terbuka.

Selain itu, dengan adanya dukungan audit dan penjelajah blockchain seperti Solscan.io, pengguna bisa dengan mudah memverifikasi transaksi staking mereka dan memantau hadiah yang diterima secara transparan.

Dampak Terhadap Harga SOLCEX dan Masa Depan SolCex

Peluncuran fitur staking ini diprediksi akan berdampak positif pada harga koin SOLCEX dalam jangka menengah hingga panjang. Dalam banyak kasus, pengenalan fitur staking sering kali diikuti oleh kenaikan harga token, karena investor berlomba-lomba untuk mengunci aset mereka dan menerima imbalan staking. Dengan permintaan yang meningkat dan pasokan koin yang terkunci, tekanan beli dapat mendorong harga SOLCEX naik.

Selain itu, staking juga berpotensi menarik lebih banyak pengguna baru ke platform SolCex. Investor yang belum tertarik untuk berdagang aktif mungkin akan menemukan staking sebagai pilihan yang lebih aman dan menarik, karena mereka dapat memperoleh keuntungan tanpa harus terlibat dalam volatilitas perdagangan harian.

Ke depan, SolCex bisa terus memperluas ekosistemnya dengan fitur-fitur tambahan yang memperkuat utilitas koin SOLCEX. Peluncuran staking hanyalah awal dari berbagai inovasi yang mungkin dihadirkan oleh SolCex untuk menarik lebih banyak pengguna dan membangun komunitas yang solid di dalam pasar kripto.

Kesimpulan

Peluncuran fitur staking SolCex pada tanggal 29 Oktober 2024 merupakan tonggak penting dalam perkembangan platform ini. Fitur ini tidak hanya menawarkan peluang penghasilan pasif bagi investor, tetapi juga memperkuat keamanan dan stabilitas jaringan blockchain SolCex secara keseluruhan. Dengan antusiasme yang tinggi dari komunitas dan dukungan yang kuat dari para pengguna, SolCex memiliki potensi untuk terus tumbuh dan menjadi salah satu pemain utama dalam dunia kripto.

Bagi investor yang ingin mendapatkan keuntungan jangka panjang, fitur staking ini bisa menjadi strategi yang tepat. Dengan staking, investor dapat terus meningkatkan portofolio mereka sambil mendukung perkembangan jaringan SolCex. Mark your calendar—29 Oktober akan menjadi hari penting bagi SolCex dan semua pengguna yang ingin memanfaatkan peluang besar ini. 

SolCex: Lonjakan Kapitalisasi Pasar dan Tantangan Volume Perdagangan

Dalam 24 jam terakhir, SolCex, sebuah aset kripto yang baru berkembang, menunjukkan performa yang menjanjikan di pasar kripto global. Harga SolCex tercatat mengalami peningkatan yang signifikan sebesar 4,40%, mendorong nilainya menjadi Rp 0,01269. Kenaikan ini memperlihatkan bagaimana SolCex mulai menarik perhatian pelaku pasar, meskipun ada beberapa dinamika yang perlu diperhatikan lebih dalam, terutama terkait volume perdagangan yang mengalami penurunan tajam.

Kapitalisasi Pasar Meningkat 62,87%: Tanda Kepercayaan Investor

Salah satu indikator paling menonjol dari perkembangan SolCex dalam beberapa hari terakhir adalah lonjakan kapitalisasi pasar yang mencapai 62,87%. Kini, kapitalisasi pasar SolCex berada di angka $9,89 juta. Kenaikan ini menunjukkan bahwa minat para investor terhadap koin ini terus meningkat secara signifikan. Peningkatan kapitalisasi pasar sering kali mencerminkan kepercayaan pasar terhadap potensi pertumbuhan jangka panjang dari aset tersebut, yang dalam hal ini menunjukkan bahwa SolCex sedang bergerak menuju pengakuan lebih luas di dunia kripto.

Kenaikan kapitalisasi ini dapat disebabkan oleh beberapa faktor. Pertama, spekulasi pasar yang optimis terhadap potensi SolCex di masa depan. Kedua, beberapa investor mungkin telah memperkirakan bahwa nilai SolCex masih undervalued atau berada di bawah potensi sejatinya, sehingga banyak yang mulai berinvestasi untuk mendapatkan keuntungan di kemudian hari.

Selain itu, kehadiran SolCex di beberapa platform penting juga membantu meningkatkan kepercayaan. Informasi mengenai ketersediaan audit, dukungan dari penjelajah blockchain seperti Solscan.io, serta koneksi dengan dompet kripto SolFlare dan universitas terkemuka seperti Universitas California, semakin meningkatkan kredibilitas dan legitimasi SolCex di mata investor.

Volume Perdagangan Menurun 20,43%: Sikap Hati-Hati Pedagang?

Di sisi lain, meskipun harga dan kapitalisasi pasar SolCex meningkat, volume perdagangan dalam 24 jam terakhir justru mengalami penurunan signifikan sebesar 20,43%, menjadi Rp 240,28 juta. Penurunan volume perdagangan ini dapat diartikan bahwa banyak investor atau pedagang yang saat ini lebih memilih menunggu sebelum mengambil tindakan lebih lanjut di pasar. Ini bisa menjadi sinyal bahwa para pemain pasar masih hati-hati atau sedang menunggu tanda-tanda yang lebih jelas mengenai arah pergerakan SolCex ke depan.

Penurunan volume perdagangan di tengah kenaikan harga bukanlah hal yang tidak biasa dalam dunia kripto. Kadang-kadang, setelah periode kenaikan harga, para investor memilih untuk berhati-hati dan menahan diri dari melakukan transaksi besar untuk menunggu konfirmasi tren. Dalam kasus SolCex, penurunan volume ini bisa mencerminkan sentimen bahwa meskipun kapitalisasi pasar menunjukkan lonjakan, sebagian besar investor masih mencari waktu yang tepat untuk membeli atau menjual aset mereka.

Pasokan Beredar dan Total Pasokan: Pengaruh pada Dinamika Pasar

SolCex memiliki total pasokan sebesar 1 miliar SOLCEX, dengan 780 juta koin yang sudah beredar di pasar. Dengan kata lain, mayoritas dari total pasokan sudah aktif di pasar. Ini memberikan perspektif yang menarik tentang bagaimana dinamika penawaran dan permintaan dapat mempengaruhi pergerakan harga.

Pasokan yang beredar yang tinggi ini memberikan fleksibilitas likuiditas bagi para investor, sehingga transaksi dapat dilakukan dengan lebih lancar tanpa menyebabkan lonjakan harga yang ekstrem. Namun, karena belum semua koin beredar, masih ada potensi bagi pasar untuk terus berkembang seiring dengan pelepasan koin baru ke pasar di masa mendatang.

Pergerakan Harga dan Tren Pasar

Pada grafik harga, SolCex menunjukkan pergerakan yang fluktuatif namun tetap dalam tren yang relatif stabil. Harga sempat mencapai titik tertinggi harian sebesar $0,0133 sebelum akhirnya sedikit terkoreksi. Fluktuasi ini menunjukkan bahwa meskipun SolCex sedang mengalami kenaikan, pasar kripto tetap penuh dengan volatilitas yang perlu diperhitungkan oleh para investor.

Di sisi lain, performa SolCex selama beberapa bulan terakhir juga menunjukkan perkembangan yang signifikan. Pada grafik jangka panjang, terlihat bagaimana harga SolCex mulai mengalami peningkatan yang konsisten sejak bulan September 2024. Tren kenaikan ini mengindikasikan adanya momentum positif yang terus berlanjut.

Faktor-Faktor yang Mempengaruhi SolCex

Seperti halnya dengan aset kripto lainnya, ada beberapa faktor yang mungkin memengaruhi harga SolCex dalam jangka waktu mendatang. Beberapa di antaranya adalah:

  1. Perkembangan Teknologi Blockchain Solana: Sebagai koin yang berbasis pada blockchain Solana, perkembangan atau upgrade dari platform Solana dapat mempengaruhi harga SolCex secara langsung. Jika Solana menghadirkan peningkatan yang signifikan dalam hal kecepatan transaksi atau keamanan, ini bisa memperkuat posisi SolCex di pasar.

  2. Kondisi Pasar Kripto Secara Umum: Pergerakan harga SolCex juga sangat bergantung pada kondisi umum pasar kripto. Misalnya, jika Bitcoin atau Ethereum mengalami kenaikan harga besar-besaran, sering kali ini akan menarik aset-aset lain untuk mengikuti tren tersebut. Sebaliknya, jika pasar kripto mengalami koreksi besar, SolCex juga dapat terdampak negatif.

  3. Regulasi Kripto Global: Kebijakan regulasi dari negara-negara besar, seperti AS atau Uni Eropa, juga bisa mempengaruhi pergerakan harga SolCex. Jika ada regulasi yang lebih ketat terhadap perdagangan kripto, ini bisa menekan permintaan SolCex. Sebaliknya, regulasi yang lebih ramah terhadap kripto bisa membantu memperkuat minat terhadap aset ini.

Kesimpulan: Apa Selanjutnya untuk SolCex?

Dengan kapitalisasi pasar yang meningkat tajam dan harga yang terus menunjukkan tren positif, SolCex jelas menjadi salah satu koin yang patut diperhatikan oleh para investor dan pengamat pasar kripto. Meskipun volume perdagangan menurun, hal ini mungkin hanya mencerminkan sikap hati-hati sesaat dari pelaku pasar.

Ke depan, SolCex memiliki potensi untuk terus berkembang, terutama jika adopsi blockchain Solana semakin luas dan koin ini mendapatkan lebih banyak dukungan dari komunitas kripto global. Para investor yang tertarik dengan SolCex disarankan untuk terus memantau pergerakan pasar dan dinamika harga yang dapat berubah sewaktu-waktu. Dengan volatilitas yang tetap tinggi di pasar kripto, peluang besar juga disertai dengan risiko yang tak terelakkan.

Namun, bagi mereka yang siap menghadapi tantangan ini, SolCex mungkin bisa menjadi salah satu kunci menuju keuntungan investasi jangka panjang di dunia kripto.

Today, Ethereum (ETH) is trading at approximately $2,621.19, reflecting a slight decline of 0.07% from the previous day. The recent price movement shows Ethereum struggling to maintain upward momentum, as indicated by its failure to break key resistance levels near $2,800.

Ethereum Price Update - October 23, 2024


Today, Ethereum (ETH) is trading at approximately $2,621.19, reflecting a slight decline of 0.07% from the previous day. The recent price movement shows Ethereum struggling to maintain upward momentum, as indicated by its failure to break key resistance levels near $2,800.

Technical Analysis

  1. Price Movement: Ethereum has been moving in a volatile range over the past few months, with major resistance near $2,800 and support around $2,200. The chart shows Ethereum testing these levels, but without a breakout either way. The current consolidation reflects a cautious market awaiting clearer direction.

  2. RSI Divergence: The RSI (Relative Strength Index) currently stands at 55.29, which is a neutral zone, signaling that Ethereum is neither overbought nor oversold. However, the RSI has shown previous bearish divergences earlier in the year, suggesting some underlying weakness in momentum. Traders are keeping an eye on potential RSI shifts for future bullish or bearish signals.

  3. Market Sentiment: Sentiment around Ethereum is influenced by both the broader macroeconomic environment and specific developments in the crypto space. The ongoing discussions around Ethereum 2.0 and staking rewards, coupled with regulatory uncertainties globally, continue to create mixed reactions from investors​

Short-term Outlook

Ethereum is currently at a crossroads, with prices fluctuating between key resistance and support levels. A strong breakout above $2,800 could signal a new bullish trend, while a failure to hold support around $2,400 may lead to further downside. Market participants are closely watching for signals from both the broader economy and Ethereum-specific updates to inform their strategies.

In the short term, Ethereum will likely remain range-bound until stronger catalysts emerge.

Today, Bitcoin is trading at around $57,826.55, showing a slight drop of 0.44% from the previous high of $59,473.54. Over the past few days,

Bitcoin Price Update - October 23, 2024

Today, Bitcoin is trading at around $57,826.55, showing a slight drop of 0.44% from the previous high of $59,473.54. Over the past few days, Bitcoin has fluctuated within a descending channel pattern, a formation that's been in place since late 2023. As depicted in the chart, Bitcoin recently attempted to break through the resistance at $68,000 but was rejected, causing the price to pull back. The current support within this channel lies near $52,000, which is a crucial level to watch.

Technical Analysis

  1. Descending Channel: Bitcoin is trading within a long-standing descending channel, limiting upward price movement. The price needs to break out of this channel for a significant rally, otherwise, a further decline toward the lower support line near $52,000 may be expected.

  2. RSI Divergence: The Relative Strength Index (RSI) currently sits at 60.92, indicating moderate momentum. Historically, when Bitcoin approaches these levels within the channel, it faces resistance, suggesting the bulls are weakening. While no strong divergence is present, traders are cautious about entering large positions until clearer signals emerge.

  3. Market Sentiment: The broader crypto market sentiment remains cautious due to macroeconomic factors such as rising interest rates, global inflation concerns, and recent sell-offs by major institutions like Genesis Trading. Additionally, regulatory scrutiny from the U.S. has added to the uncertainty, causing volatility in the market​

Short-term Outlook

Although Bitcoin's recent pullback has disappointed bullish traders, market sentiment could shift depending on upcoming macroeconomic data and potential institutional investment. If Bitcoin can break above the $68,000 resistance level, it may signal a larger upward movement. However, failure to hold key support levels could lead to further downside toward $52,000.

Traders are advised to keep an eye on major news affecting both traditional markets and crypto-specific developments, as these will likely influence Bitcoin's next big move.

Ethereum (ETH) Jumps to $2,750.98, Market Surge Boosted by Heavy Trading Volume


Ethereum (ETH) Jumps to $2,750.98, Market Surge Boosted by Heavy Trading Volume

Ethereum (ETH), the second-largest cryptocurrency by market capitalization, has surged to $2,750.98, reflecting a 3.68% increase in the last hour. The rising momentum is driven by a significant spike in trading activity, positioning Ethereum for another strong market cycle.

Key Highlights:

  • Market Cap: Ethereum's market cap has risen to $331.19 billion, representing a 3.68% increase, showcasing renewed investor interest in the cryptocurrency.
  • 24-Hour Volume: The 24-hour trading volume skyrocketed by 68.79%, reaching $14.38 billion, indicating heightened market activity and speculative interest.
  • Fully Diluted Valuation (FDV): Ethereum’s FDV stands at $331.19 billion, emphasizing its role as a leading digital asset in the DeFi ecosystem.
  • Circulating Supply: The total circulating supply is 120.39 million ETH, with its inflationary supply model drawing both curiosity and criticism in the market.

Market Overview

Ethereum's price increase can be attributed to several factors, including positive market sentiment, increasing institutional adoption, and the continuous evolution of the Ethereum blockchain ecosystem. As Ethereum transitions toward Ethereum 2.0 with its Proof of Stake (PoS) consensus, anticipation surrounding network upgrades continues to push the price upwards.

Investors are keeping a close eye on the performance of ETH as it could set the stage for future price movements in the altcoin market. The rapid increase in volume over the last 24 hours suggests the possibility of further gains in the near term.

Bitcoin (BTC) Surges to $69,079, Reaching New Heights with Increased Market Activity


Bitcoin (BTC) Surges to $69,079, Reaching New Heights with Increased Market Activity

Bitcoin (BTC), the leading cryptocurrency by market cap, has once again broken past the $69,000 mark, trading at $69,079.88. This represents a 1.05% increase in just the last hour, signaling a strong bullish momentum in the market.

Key Highlights:

  • Market Cap: Bitcoin's market capitalization stands at an impressive $1.37 trillion, up 1.05% over the past day, further cementing its position as the world's most valuable digital asset.
  • 24-Hour Volume: Trading activity has surged significantly, with the 24-hour volume hitting $18.62 billion, a massive 29.55% increase, reflecting heightened interest from both retail and institutional investors.
  • Fully Diluted Valuation (FDV): The FDV of Bitcoin is currently at $1.45 trillion, with the remaining supply being closely monitored as Bitcoin approaches its maximum cap.
  • Circulating Supply: Out of a total supply of 21 million BTC, 19.77 million BTC are already in circulation, nearing the limit, which could further drive scarcity and demand.

Market Outlook

Bitcoin's strong performance comes amid growing optimism about institutional adoption and the potential for broader regulatory clarity. The sharp increase in volume shows renewed confidence in the asset, especially as it approaches all-time highs.

Mumu the Bull (MUMU) Sees Significant 624% Surge Amid Rising Market Interest


Mumu the Bull (MUMU) Sees Significant 624% Surge Amid Rising Market Interest

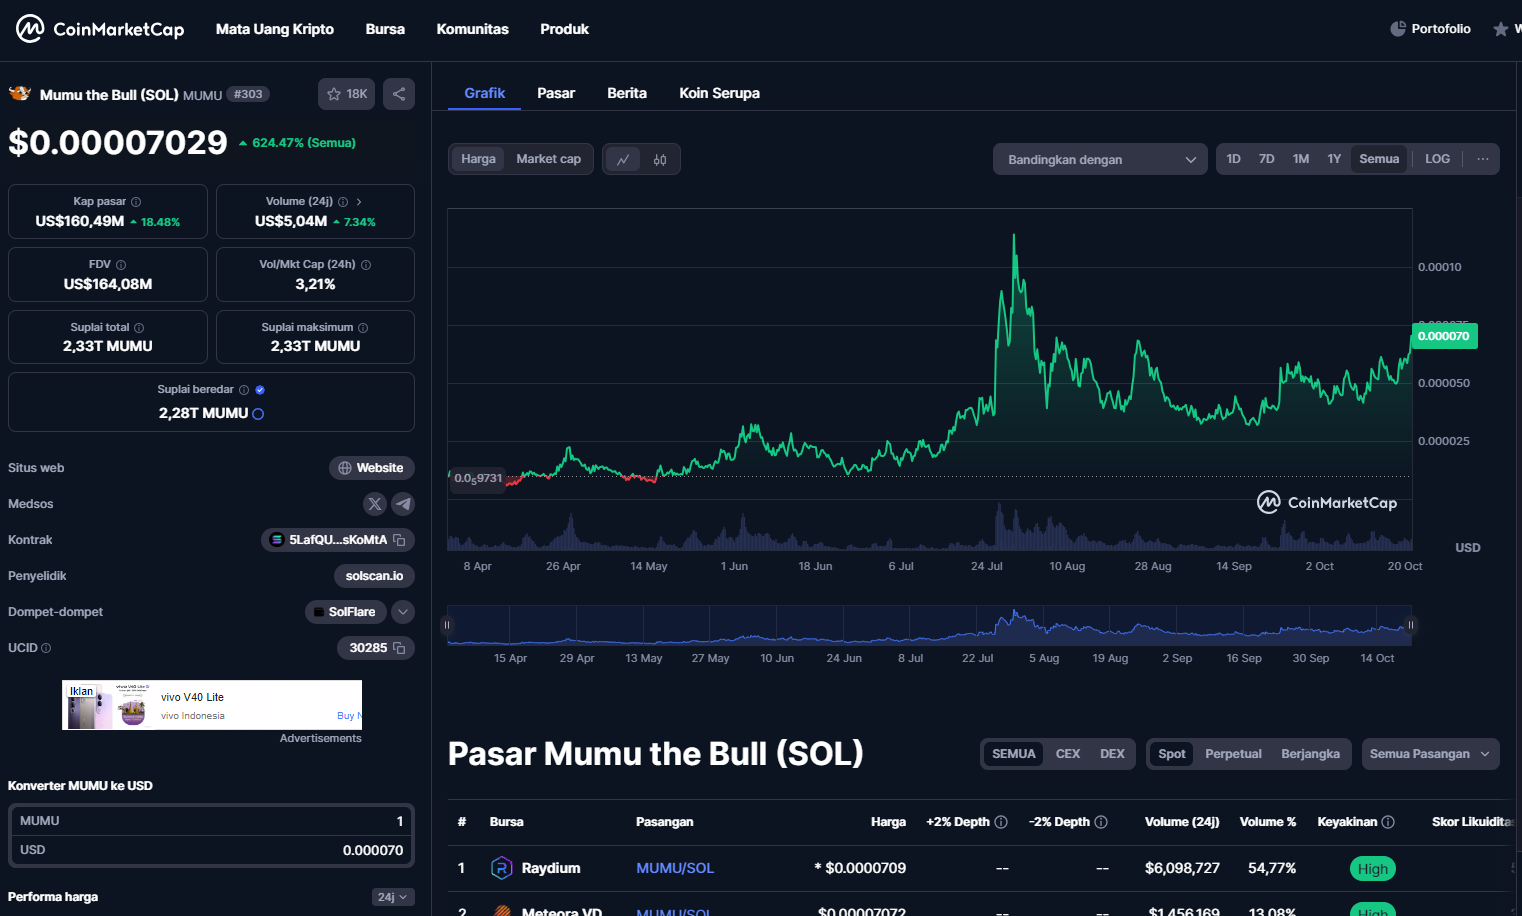
Mumu the Bull (MUMU), a cryptocurrency on the Solana blockchain, is experiencing an extraordinary rise in value, currently trading at $0.00007029. The token has surged by an impressive 624.47%, catching the attention of the broader crypto community.

Key Highlights:

  • Market Cap: MUMU's market capitalization has grown to $160.49 million, reflecting an 18.48% increase over the past 24 hours.
  • 24-Hour Volume: The trading volume in the last 24 hours reached $5.04 million, with a significant 7.34% gain in market activity, showing robust investor interest.
  • Total Supply: Out of a maximum supply of 2.33 trillion MUMU, around 2.28 trillion tokens are already in circulation.

Recent Performance

Over the past months, Mumu the Bull has shown promising momentum. The token saw its peak around mid-July 2024, when it spiked close to $0.00010, before retracing. Despite volatility, it has maintained steady gains, with recent data showing renewed growth as it crossed the $0.000070 mark.

Current Market Activity

MUMU is actively traded on decentralized exchanges like Raydium, where it is paired with SOL. The price of MUMU/SOL on Raydium is currently $0.0000709, making Raydium one of the top venues for MUMU trades, contributing over 54.77% of the total trading volume.

The token's impressive performance signals growing demand, driven by a combination of speculative interest and potential use cases within the Solana ecosystem.